
BITCOIN

Tether Dominance USDT.D
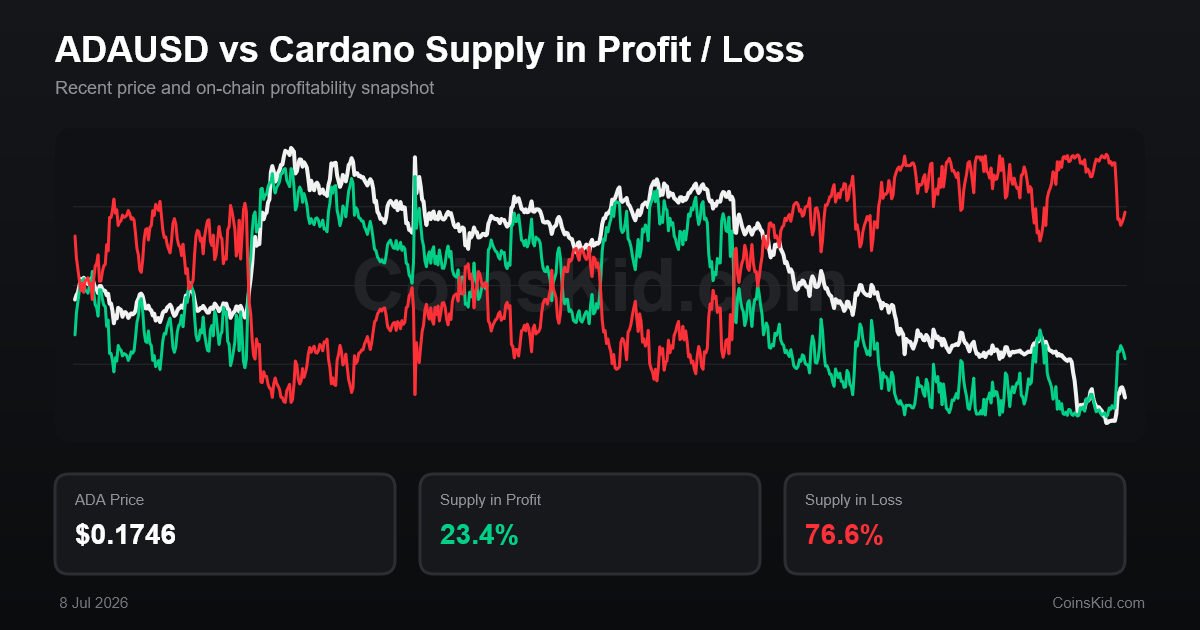
ADAUSD vs Cardano Supply in Profit / Loss
Reading Cardano Supply in Profit and Loss
This chart gives you a quick view of how the Cardano market is positioned beneath the surface. The green line shows the share of Cardano supply sitting in profit, while the red line shows the share sitting in loss. Together they help reveal whether recently active holders are comfortable, under pressure or beginning to capitulate.
Strong momentum, but watch for overheating
Most holders are sitting on gains and confidence is usually high. When supply in loss is pressed close to the 0% line, the market can be entering a late-cycle or distribution phase, so the risk of profit-taking starts to rise.
Healthy trending conditions
The market is generally constructive and most holders remain in profit, but conditions are not yet at the same extreme levels often seen near major cycle peaks.
A market in transition
Profit and loss are more evenly split, which often appears during consolidation, uncertainty or a broader change in market direction.
Fear, stress and possible capitulation
A large part of the market is underwater. When supply in loss pushes towards 50%, it has often appeared during the later stages of a bear market, when long-term accumulation opportunities may begin to form.
One of the most useful signals is when the supply-in-loss line falls close to the 0% baseline. That tells you almost everyone is in profit, which can coincide with euphoria and increasing distribution risk.
A sharp rise in supply held at a loss shows growing pressure across the market. Readings near the 50% area have historically appeared around deep bear-market stress and capitulation.
How to read the ADAUSD vs Cardano Supply in Profit / Loss chart
Watch this walkthrough to understand what the profit and loss lines mean, how to spot potential cycle tops and bottoms, and how to use the chart alongside Cardano price.
 CoinsKid.Com