
BITCOIN

Tether Dominance USDT.D
Bitcoin Coinbase Premium Index
How to read the Bitcoin Coinbase Premium Index
The Coinbase Premium Index measures the percentage gap between Coinbase BTC-USD and Binance BTCUSDT. Rather than treating the number as a simple buy or sell signal, the useful information comes from watching how the premium behaves alongside Bitcoin itself. A sustained premium can reveal stronger Coinbase-side demand, while a persistent discount can show that Coinbase is lagging the Binance market.
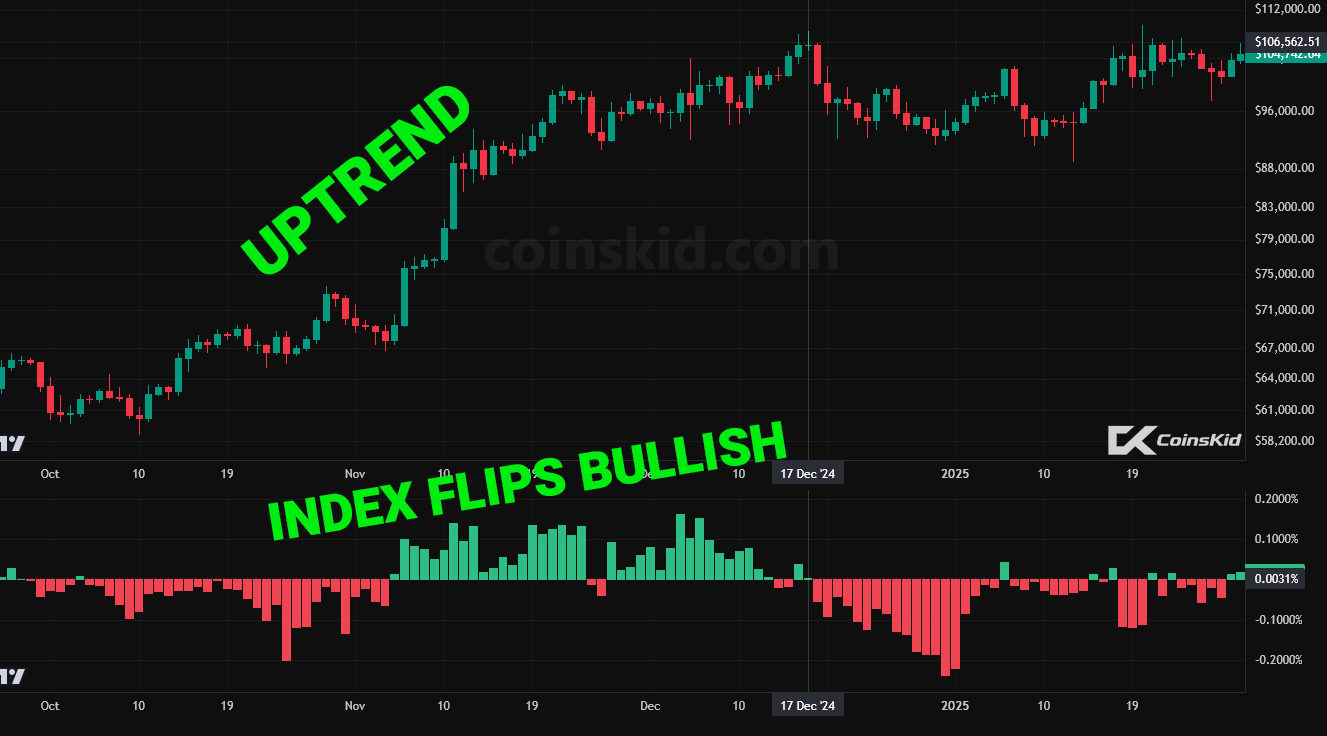
Here Bitcoin is advancing while the premium pushes above zero and stays there. The useful part is the persistence: Coinbase is repeatedly pricing BTC above Binance, suggesting stronger Coinbase-side demand is accompanying the move rather than a single short-lived pricing imbalance.
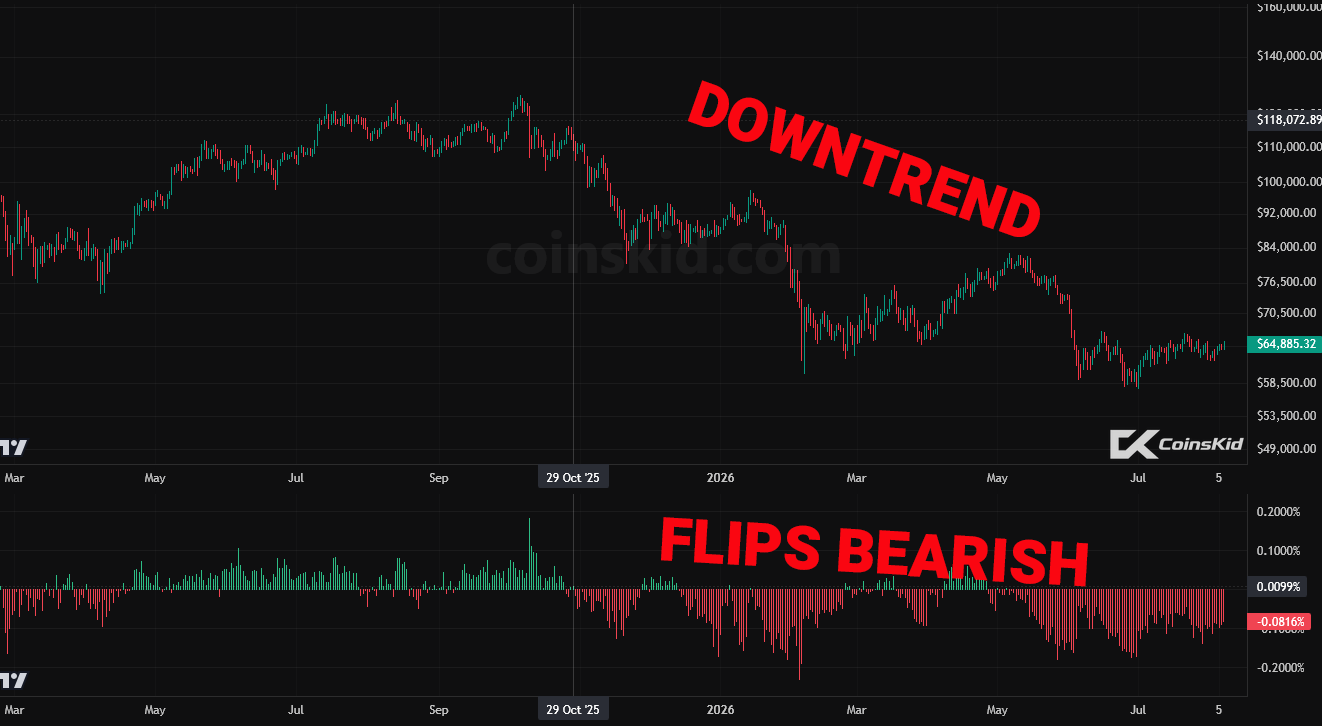
In this example the premium remains below zero while Bitcoin weakens. That does not prove Coinbase caused the decline, but it does show BTC is repeatedly cheaper on Coinbase than on Binance — a useful sign that Coinbase-side demand is not confirming the broader market move.
Treat zero as the dividing line between two market regimes. Above it, Coinbase BTC-USD is priced higher than Binance BTCUSDT; below it, Coinbase is priced lower. The most important question is not whether one bar is green or red, but which side of zero keeps winning over time.
A regime change is often more informative than a single extreme print. When a long negative stretch gives way to repeated positive readings, the relative strength of Coinbase demand may be changing. The reverse can signal that Coinbase is beginning to lag.
Rising Bitcoin alongside a persistent positive premium is a constructive combination. Price strength is being accompanied by Coinbase trading above Binance, which suggests the US-facing spot market is participating in the move rather than clearly lagging it.
When Bitcoin is falling and the premium stays negative, Coinbase is also trading at a relative discount. That combination can point to weaker Coinbase-side demand, although the premium should be read as confirmation rather than proof of what is driving the move.
Large bars show moments when the two exchanges temporarily move further apart than usual. These events can matter, but context is everything: a spike that quickly disappears is very different from an extreme reading that develops into a multi-day regime.
Divergence is one of the more interesting uses of the index. If Bitcoin pushes higher while the premium steadily deteriorates, Coinbase demand is failing to confirm price strength. If Bitcoin remains weak while the premium improves, the opposite may be developing beneath the surface.
Exchange spreads naturally flicker around as liquidity shifts. That makes persistence more valuable than noise. A string of readings on the same side of zero usually carries more information than reacting to every isolated daily bar.
Use the premium as one layer of evidence. Combine it with Bitcoin structure, volume, momentum, ETF flows, exchange flows and liquidity. When several independent signals point in the same direction, the reading is far more useful than the premium on its own.
Think of the Coinbase Premium Index as a market-behaviour tool, not an automatic trade signal. First identify whether the premium is positive or negative, then ask whether that regime is persistent, whether Bitcoin price agrees with it, and whether a divergence is developing. The streak monitor above helps separate a genuine shift in behaviour from a one-day exchange imbalance.
 CoinsKid.Com