
BITCOIN

Tether Dominance USDT.D
How to identify a 5-waves down C-wave (classic “bottoming” setup)
This is a practical checklist for spotting the final leg down in a larger correction (Wave C), where price often prints five smaller waves into a low before reversing and breaking out after a 3rd point of contact. The work on micro and macro timeframes.
1) Make sure you’re actually in a C-wave
A Wave C is usually the “last dump” after an A-B bounce. The structure is commonly: A down → B up → C down.
- Wave A: first sharp sell-off (breaks prior support).
- Wave B: relief rally that fails (lower high / resistance).
- Wave C: another sell-off that often matches or exceeds Wave A severity.
2) Count the 5 smaller waves inside C
The C-wave itself often breaks into five sub-waves (1-2-3-4-5). You don’t need perfection—just the idea of: push down, bounce, stronger push, bounce, final push.
The most common features:
- Wave 3 is usually the longest/ugliest (most acceleration, most fear).
- Wave 4 often chops sideways and fails to reclaim prior breakdown level.
- Wave 5 is the “last flush” into support (often with divergence).
3) What “confirms” the bottom zone (what to look for)
You want confluence. These are the best tells that the 5th wave is ending:
A) Bullish divergence (best visual confirmation)
- Price makes a lower low into Wave 5…
- Your oscillator (RSI/F&G micro line etc.) makes a higher low.
B) Break of the last lower-high (structure shift)
- After Wave 5 forms, price breaks above the most recent minor lower-high.
- Then you often see a pullback that holds higher (new support).
C) Capitulation vibes (optional but common)
- Big red candle(s), high volatility, sentiment at extremes.
- Then momentum stalls: smaller red candles, fewer follow-through dumps.
4) The “don’t get trapped” rules
Not financial advice — this is a pattern-recognition guide. Always use risk management.
Visual examples
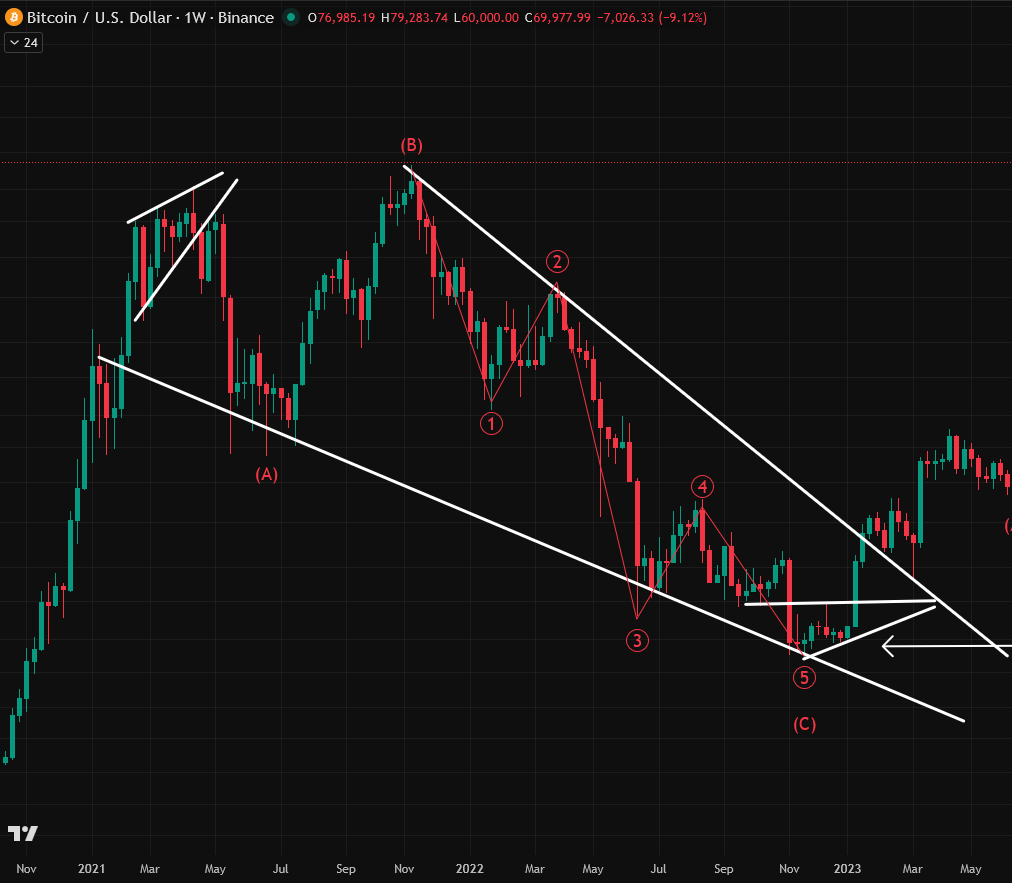
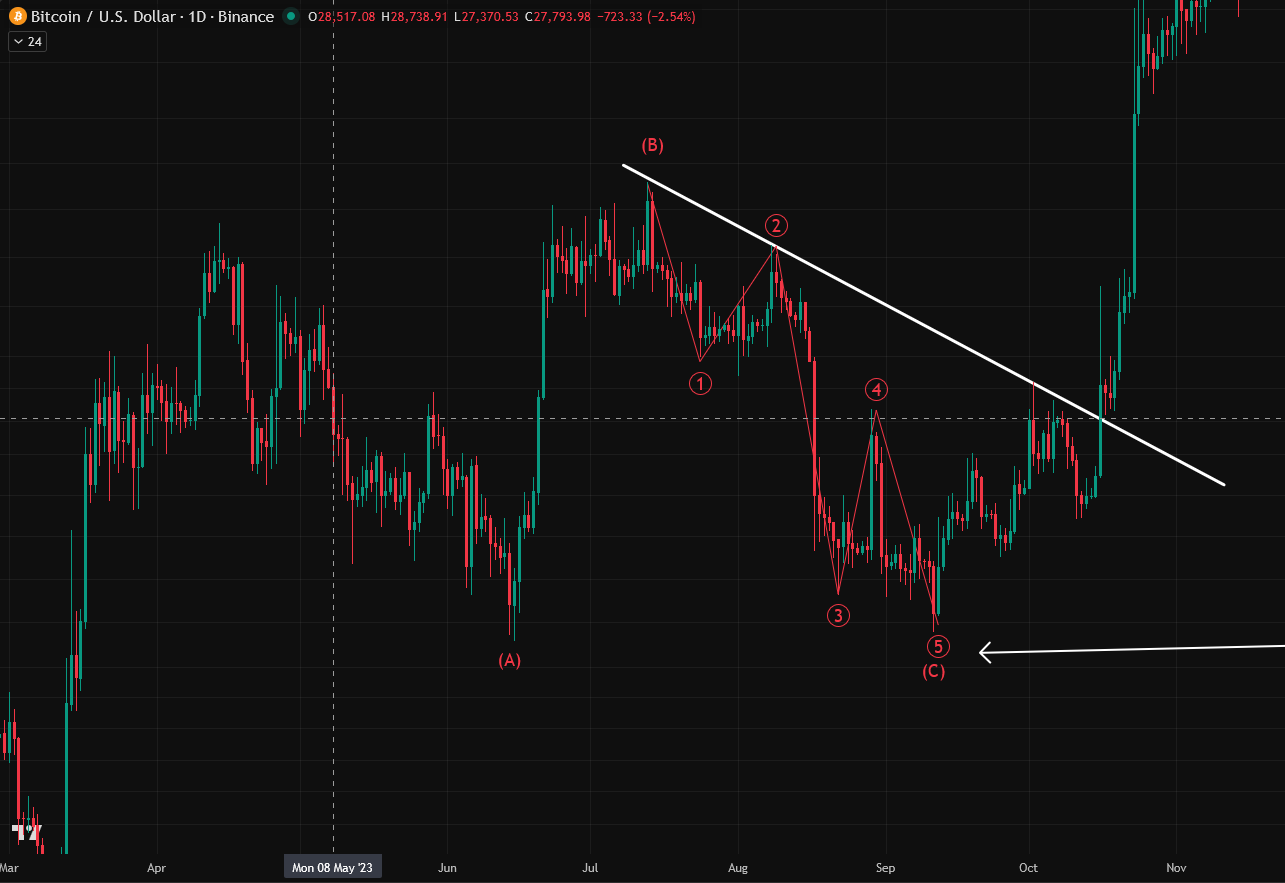
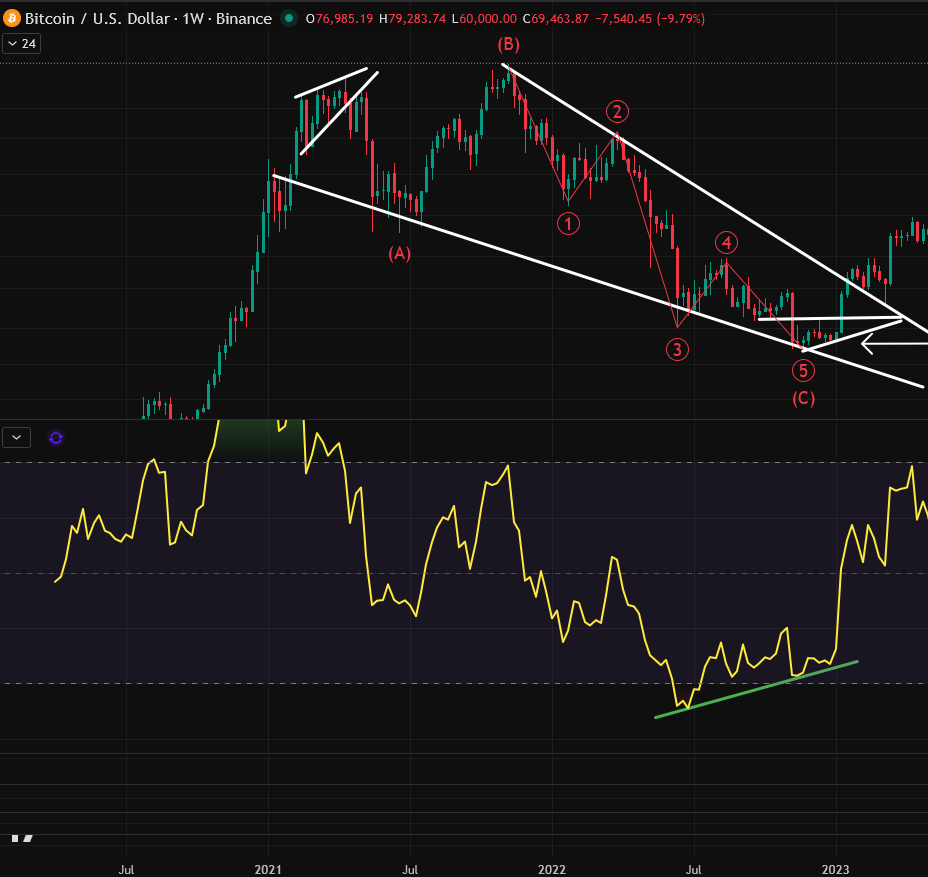
Quick “bottom zone” checklist
 CoinsKid.Com
This is not financial advice it is just an opinion! We are not experts! We do not guarantee a outcome we have no inside knowledge! Please do your own research and make your own decisions! This is just education & entertainment!
Financial charting on this site is powered by TradingView. Stay informed about upcoming events with TradingView’s economic calendar.